
Introduction
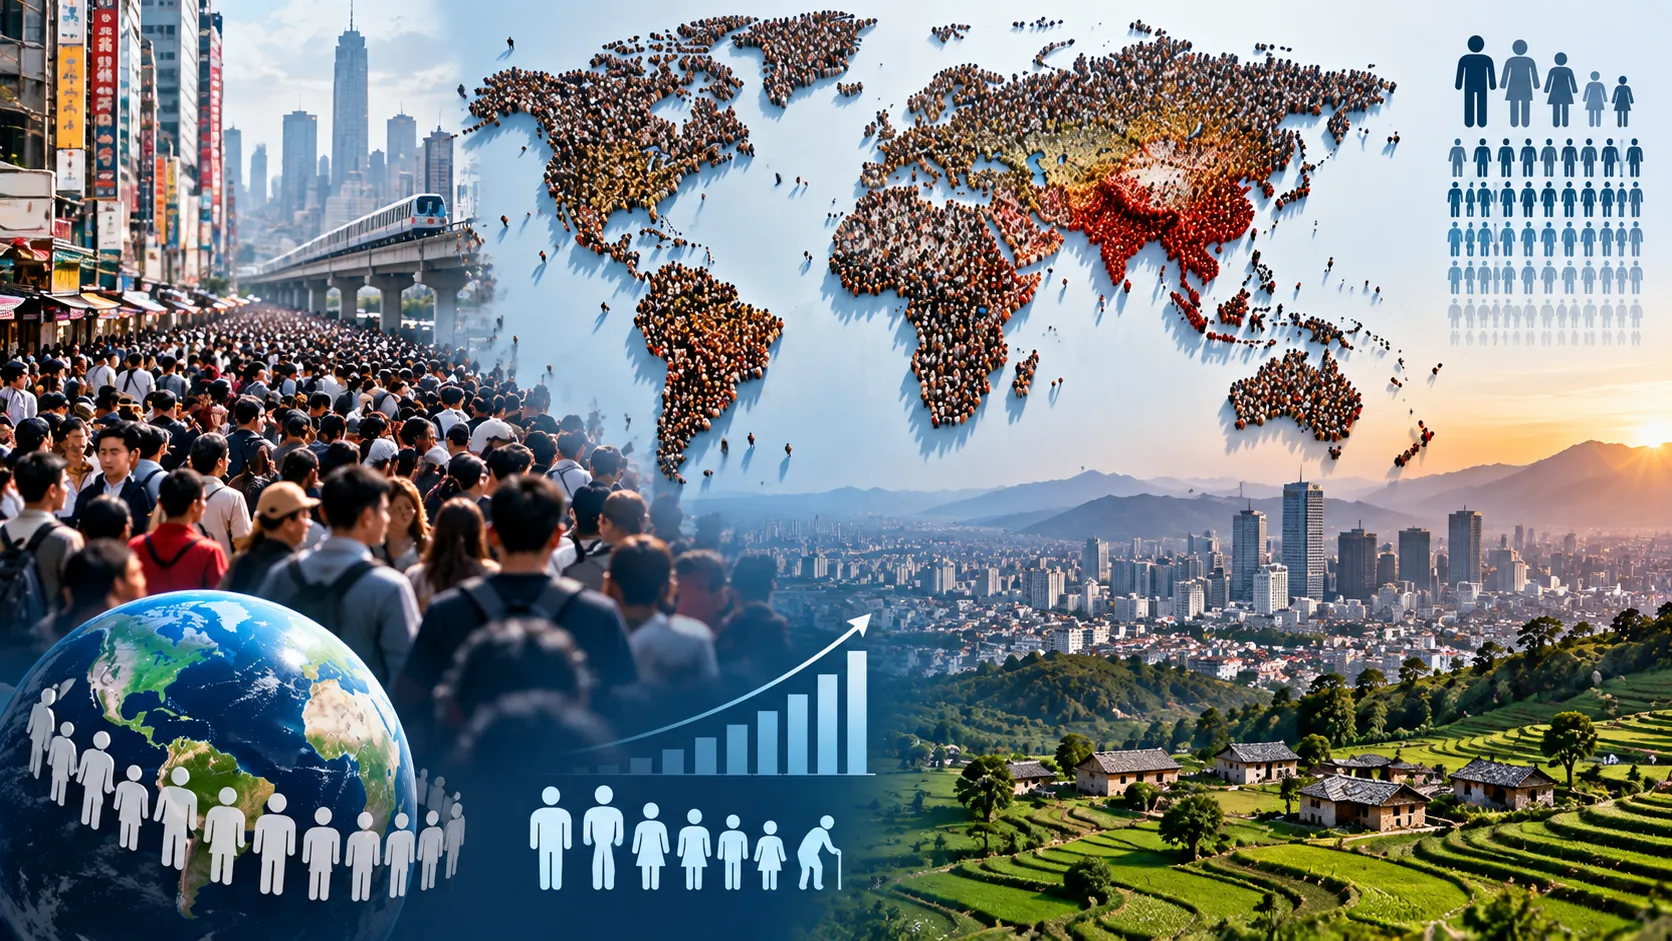
Population geography studies where people live, how populations change, and why some places contain far more people than others. A country's total population tells us how many people live there, but it does not show how those people are distributed across its territory.
Population density measures the concentration of people in an area. A large country can have a huge population but relatively low average density, while a small country or city can have a much smaller population but extremely high density.
Population patterns are influenced by climate, terrain, water, agriculture, jobs, transportation, history, migration, and government policies. Understanding population and density helps explain urban growth, settlement patterns, resource demand, migration, infrastructure needs, and differences between rural and urban areas.
Learning Objectives
After studying this guide, you should be able to:
· Define population, population distribution, and population density.
· Calculate arithmetic population density.
· Distinguish arithmetic, physiological, and agricultural density.
· Explain why population is unevenly distributed.
· Describe how births, deaths, and migration change population size.
· Interpret basic population pyramids and demographic trends.
What Is Population?
A population is the number of people living within a particular geographic area.
The area could be:
· A village
· A city
· A province or state
· A country
· A continent
· The entire world
Population statistics are usually obtained through censuses, registration systems, surveys, and demographic estimates.
A census is an official count and statistical description of a population. Governments use census information to understand where people live and to plan services such as schools, hospitals, transportation, housing, and infrastructure.
Population Size vs. Population Density
Population size and population density are different concepts.
Population size tells us the total number of people.
Population density tells us how concentrated those people are within a particular area.
Imagine two regions:
Region | Population | Land Area | Density |
Region A | 1,000,000 | 10,000 km² | 100 people/km² |
Region B | 500,000 | 1,000 km² | 500 people/km² |
Region A has twice as many people, but Region B is five times as densely populated.
This distinction is one of the most important concepts in population geography.
What Is Population Density?
Population density is the number of people living per unit of land area.
The World Bank defines its population-density indicator as midyear population divided by land area, generally expressed as people per square kilometer.
The basic formula is:
Population Density = Population ÷ Land Area
Example
Suppose a region contains:
· Population: 600,000
· Land area: 3,000 km²
Then:
600,000 ÷ 3,000 = 200
The population density is:
200 people per square kilometer
Density may also be expressed as people per square mile.
Arithmetic Population Density
Arithmetic density is the most common measure of population density.
It is calculated by dividing the total population by the total land area.
For example:
Arithmetic Density = Total Population ÷ Total Land Area
This measure is useful for comparing countries and regions.
However, arithmetic density has an important weakness: it assumes population is spread evenly across the entire area.
In reality, people often cluster in cities, river valleys, coastal regions, and fertile plains while deserts, mountains, forests, and other areas remain sparsely populated. The U.S. Census Bureau notes that a national average density does not mean people are actually distributed evenly across the land.
Physiological Density
Physiological density compares population with the amount of arable land available.
Arable land is land suitable for growing crops.
The simplified formula is:
Physiological Density = Total Population ÷ Arable Land Area
This measure can reveal pressure on productive agricultural land more clearly than arithmetic density.
Imagine two countries with the same population and total area. One consists mostly of fertile plains, while the other contains large deserts and mountains.
Their arithmetic densities might be identical, but the country with much less farmland would have a much higher physiological density.
Why It Matters
A high physiological density can indicate that many people depend on a relatively small amount of agricultural land.
However, it does not automatically mean a country will experience food shortages. Trade, agricultural technology, irrigation, income, transportation, and food imports also matter.
Agricultural Density
Agricultural density compares the number of agricultural workers with the amount of arable land.
A simplified formula is:
Agricultural Density = Agricultural Population ÷ Arable Land Area
Agricultural density can provide clues about farming practices.
A high agricultural density may indicate that many farmers work relatively small areas of farmland.
A lower agricultural density may occur where agriculture is highly mechanized and fewer workers farm large areas.
Three Density Measures Compared
Density Type | Calculation | What It Helps Show |
Arithmetic | Total population ÷ total land | Overall population concentration |
Physiological | Total population ÷ arable land | Pressure on productive farmland |
Agricultural | Agricultural population ÷ arable land | Relationship between farmers and farmland |
For most basic quiz questions, population density without another qualifier usually refers to arithmetic density.
Population Distribution
Population distribution describes how people are spread across an area.
A population can be:
· Concentrated
· Dispersed
· Clustered
· Linear
· Unevenly distributed
Population density gives an average number. Population distribution shows the actual spatial pattern.
Two countries could have the same average density but completely different distributions.
In one country, most residents might be concentrated along a coast. In another, people might be spread among several inland cities.
Why Population Is Unevenly Distributed
People do not settle randomly. Physical and human factors influence where large populations develop.
Water Availability
Freshwater is essential for drinking, agriculture, industry, and sanitation.
River valleys and areas with reliable groundwater have historically attracted settlement.
Climate
Regions with moderate temperatures and adequate rainfall often support larger populations than areas with extreme heat, cold, or dryness.
Climate is not an absolute barrier, however. Technology can support large cities even in difficult environments.
Terrain
Flat plains and river valleys usually make construction, agriculture, and transportation easier.
Steep mountains can limit settlement because roads, buildings, and farming are more difficult to develop.
Fertile Soil
Productive agricultural land can support larger populations by providing food and economic opportunities.
Many early civilizations developed in fertile river valleys.
Employment
Industrial centers, ports, commercial districts, mining areas, and service economies attract workers.
Jobs can therefore create dense urban populations even in regions with physical environments that are not naturally favorable.
Transportation
Major roads, rivers, railways, ports, and transportation junctions encourage settlement and economic development.
Political and Historical Factors
Government policies, wars, borders, colonization, migration, land ownership, and historical trade routes can all influence settlement patterns.
Densely and Sparsely Populated Areas
A densely populated region contains many people relative to its area.
Dense settlement often occurs in:
· Cities
· Fertile plains
· River valleys
· Coastal areas
· Industrial regions
· Major transportation corridors
A sparsely populated region contains relatively few people.
Sparse settlement often occurs in:
· Deserts
· Polar regions
· High mountains
· Dense forests
· Remote areas
· Regions with severe water shortages
These are general patterns rather than absolute rules.
Population Change
Population size changes through three main demographic processes:
Births, deaths, and migration.
A simplified population equation is:
Population Change = Births − Deaths + Immigration − Emigration
If births and immigration exceed deaths and emigration, population grows.
If deaths and emigration exceed births and immigration, population declines.
Birth Rate
The crude birth rate measures the number of live births during a year relative to the total population, commonly expressed per 1,000 people.
Birth rates can be influenced by:
· Age structure
· Cultural patterns
· Education
· Income
· Access to healthcare
· Urbanization
· Family preferences
· Government policies
Birth rate should not be confused with fertility rate, which measures childbearing in a different way.
Death Rate
The crude death rate measures deaths during a year relative to the total population, commonly expressed per 1,000 people.
Death rates can be affected by:
· Age structure
· Healthcare
· Nutrition
· Disease
· Conflict
· Natural disasters
· Living conditions
A country with many older people may have a relatively high crude death rate even if healthcare is excellent.
Natural Increase
Natural increase measures population change from births and deaths alone.
A simple relationship is:
Natural Increase = Births − Deaths
Migration is not included.
If births exceed deaths, there is natural increase.
If deaths exceed births, there is natural decrease.
Migration
Migration is the movement of people from one place to another with the intention of changing residence for some period.
Immigration
Immigration means moving into a country or region.
Emigration
Emigration means moving out of a country or region.
A useful memory trick is:
Immigration = In
Emigration = Exit
Net Migration
Net migration compares immigration and emigration.
If more people arrive than leave, an area has positive net migration.
If more people leave than arrive, it has negative net migration.
Push and Pull Factors
Migration is often explained through push and pull factors.
Push Factors
Push factors encourage people to leave a place.
Examples include:
· Conflict
· Unemployment
· Environmental hazards
· Persecution
· Lack of services
· Food insecurity
Pull Factors
Pull factors attract people to a destination.
Examples include:
· Employment
· Education
· Safety
· Family connections
· Higher wages
· Better services
A person's migration decision may involve several push and pull factors at the same time.
Urbanization
Urbanization is the process through which an increasing share of a population lives in urban areas.
Urbanization often accompanies economic changes as employment shifts from agriculture toward industry and services.
Urban areas can provide concentrated access to employment, education, healthcare, transportation, and other services. They may also face congestion, housing shortages, pollution, infrastructure pressure, and inequalities.
Comparisons between countries require caution because there is no single worldwide definition of what counts as "urban." National statistical systems use different population thresholds, administrative rules, and settlement characteristics.
Population Growth
A population's growth rate describes how quickly its size is increasing or decreasing.
Even apparently small percentage growth rates can produce large numerical changes when applied to a large population over many years.
Population growth is affected by:
· Fertility
· Mortality
· Immigration
· Emigration
· Population age structure
Growth rates can therefore differ greatly among countries and regions.
Demographic Transition
The demographic transition model explains a common long-term pattern in which populations move from high birth and death rates toward low birth and death rates.
The United Nations describes demographic transition as the long-term shift from high fertility and mortality toward low fertility and mortality, accompanied by major changes in population growth and age structure.
A simplified model includes:
Stage 1: High Birth Rate, High Death Rate
Population growth is slow because many births are balanced by many deaths.
Stage 2: High Birth Rate, Falling Death Rate
Death rates decline because of improvements that may include sanitation, food supply, healthcare, and public health.
Population grows rapidly because birth rates remain high.
Stage 3: Falling Birth Rate, Low Death Rate
Birth rates begin declining, reducing the speed of population growth.
Stage 4: Low Birth Rate, Low Death Rate
Population growth becomes slow or relatively stable.
Some versions add a fifth stage for populations in which births remain so low that population ageing and natural decrease may occur.
The demographic transition is a model, not a rigid rule. Countries can follow different paths.
Population Pyramids
A population pyramid is a graph showing the age and sex structure of a population.
Age groups are normally arranged from youngest at the bottom to oldest at the top.
The shape can reveal important demographic patterns.
Broad-Based Pyramid
A broad base usually indicates a large proportion of children and relatively high recent fertility.
More Rectangular Shape
A more even distribution through many age groups may indicate slower growth.
Narrow Base
A narrow base can indicate lower fertility and an ageing population.
Population pyramids are useful because population structure affects demand for schools, employment, housing, healthcare, pensions, and other services.
Dependency Ratio
The dependency ratio compares age groups that are commonly considered more dependent with the working-age population.
Children and older adults often require support through families, public services, or social programs.
However, the dependency ratio is only an age-based indicator. Not every working-age person works, and many older people remain economically active.
Carrying Capacity
Carrying capacity refers to the population that an environment can support under particular conditions without unacceptable long-term degradation.
Carrying capacity is not necessarily fixed.
It may change with:
· Technology
· Agricultural productivity
· Trade
· Water management
· Energy systems
· Consumption patterns
A region that could support only a small population using one technology might support many more people after irrigation, transportation, or agricultural improvements.
Population Density and Resources
High population density does not automatically mean poverty or overcrowding.
A dense city may function effectively if it has strong:
· Transportation
· Housing
· Water systems
· Sanitation
· Employment
· Healthcare
· Energy networks
Likewise, a sparsely populated region can experience resource shortages if water, infrastructure, or economic opportunities are limited.
Density must therefore be interpreted together with resource availability, infrastructure, technology, and living conditions.
Common Mistakes
Mistake 1: Population and Population Density Mean the Same Thing
False. Population is the total number of people. Density compares that population with area.
Mistake 2: High Population Means High Density
Not necessarily. A very large country can contain many people while still having a moderate or low average density.
Mistake 3: Population Is Spread Evenly Within a Country
False. Population density is an average. Real populations usually cluster in particular places.
Mistake 4: Immigration Means Leaving
False.
Immigration = entering.
Emigration = leaving.
Mistake 5: Urban Has Exactly the Same Definition Everywhere
False. Countries use different standards to classify urban and rural areas.
Mistake 6: Dense Population Automatically Means Overpopulation
False. Density is a measurement. Overpopulation is a more complex concept involving the relationship between population, resources, infrastructure, consumption, and environmental capacity.
Memory Tips
Remember:
Population = how many people
Density = how concentrated
Distribution = where they live
For density:
Density = People ÷ Area
For migration:
Immigration = In
Emigration = Exit
For population change:
Births add
Deaths subtract
Immigration adds
Emigration subtracts
For the demographic transition:
High–High → High–Low → Falling–Low → Low–Low
Summary
Population geography studies the number, distribution, composition, and movement of people. Population density measures the number of people relative to land area. Arithmetic density uses total land area, physiological density compares population with arable land, and agricultural density compares agricultural workers with arable land. Population is unevenly distributed because of factors such as water, climate, terrain, fertile soil, employment, transportation, history, and government policy.
Population size changes through births, deaths, immigration, and emigration. Over longer periods, changing fertility and mortality patterns can produce a demographic transition from high birth and death rates to much lower rates.
Population pyramids reveal age structure, while urbanization shows the increasing concentration of people in towns and cities. These concepts help geographers understand settlement patterns and the changing demands placed on resources, infrastructure, and public services.
FAQ
1. What is population density?
Population density is the number of people living within a particular unit of land area, usually expressed as people per square kilometer or square mile.
2. How do you calculate population density?
Divide the total population by the land area.
3. What is arithmetic density?
Arithmetic density is the total population divided by the total land area.
4. What is physiological density?
Physiological density is the total population divided by the amount of arable land.
5. What is agricultural density?
Agricultural density compares the agricultural population with the amount of arable land.
6. Why are some places densely populated?
Factors can include water, fertile land, employment, transportation, favorable terrain, historical settlement, and access to services.
7. What causes population growth?
Population grows when births and immigration exceed deaths and emigration.
8. What is the difference between immigration and emigration?
Immigration is movement into a place, while emigration is movement out of a place.
9. What is urbanization?
Urbanization is the process through which an increasing proportion of people live in urban areas.
10. What does a population pyramid show?
A population pyramid shows the age and sex structure of a population and can provide clues about fertility, ageing, and population growth.
Key Takeaways
· Population refers to the number of people, while population density measures people relative to land area.
· Arithmetic, physiological, and agricultural density measure different relationships between people and land.
· Climate, water, terrain, employment, transportation, and history help explain population distribution.
· Births, deaths, immigration, and emigration determine population change.
· Population pyramids, urbanization, migration, and demographic transition help explain how populations change over time.
References
1. World Bank. Population Density (People per sq. km of Land Area) — Metadata Glossary. Defines the population-density indicator and calculation method.
2. United States Census Bureau. Population Density. Official population-density data and geographic information.
3. United States Census Bureau. Understanding Population Density. Explains why average population density differs from actual population distribution.
4. United Nations Statistics Division. Population Density and Urbanization. Covers international demographic statistics and the challenges of comparing urban and rural classifications.
5. World Bank. Urban Population (% of Total Population) — Metadata Glossary. Explains urban-population measurement and differences among national definitions.
6. United Nations Department of Economic and Social Affairs, Population Division. Ageing and the Demographic Transition. Explains the shift from high fertility and mortality to lower fertility and mortality.
7. United Nations Department of Economic and Social Affairs, Population Division. Global Population Growth and Sustainable Development. Discusses population growth, fertility, mortality, and demographic transition.